Summary
- For 2025, market conditions are uncertain, with high risks and potential shifts; investors should react to changes rather than rely on predictions.
- The S&P 500 is dangerously overvalued, with historically high valuations, making it prone to significant corrections if economic conditions worsen.
- Key indicators to watch include consumer sentiment, credit tightening, full-time employment, and inflation, which could signal potential recessions or stagflation.
- Diversification into international investments and selective small-cap stocks, along with strategic use of options, can mitigate risks and capitalize on opportunities.

For 2024, I correctly forecast a 20% up year for the S&P 500 (SPX) and Bitcoin (BTC-USD) to $100,000. My conviction on these ideas were very high confidence.
Stock Market Euphoria To $100,000 Bitcoin, What I Got Right And Wrong In 2024
In 2024, riding your winners was the play. 2025 will not be that straightforward. Government, central banks, currencies, geopolitics and earnings are all too uncertain for a high conviction stock market call in the coming year.
In this environment, prediction gives way to reaction.
Those who glom onto trader narratives, or stubborn belief structures, will find it harder to profit. Those who react well to whatever happens will fare better.
I see risks in 2025 high and rising. But, there is also a chance that everything falls into place. Investors need to understand the potential scenarios and have a game plan for whichever ones play out. We could see two or three different market shifts by 2026.
It is important to understand the backdrop going into 2025 and the potential scenarios that can play out. Here’s what I am working through as I manage money at my firm and provide investment ideas for members of my investment group at Fundamental Trends
The S&P 500 Is Dangerously Overvalued
With around half of people indexing now to S&P 500 ETFs (SPY) (VOO) and various mutual funds, as well as, about 80% of total stock market capitalization in the S&P 500, considering the valuation of this relatively efficient and correlated market is very important to think through.
I would encourage every investor to read Apollo Global Management’s (APO), itself now an S&P 500 constituent, to read their analysis on the impact of indexing on market structure.
The Impact of Passive Investing – Apollo Academy
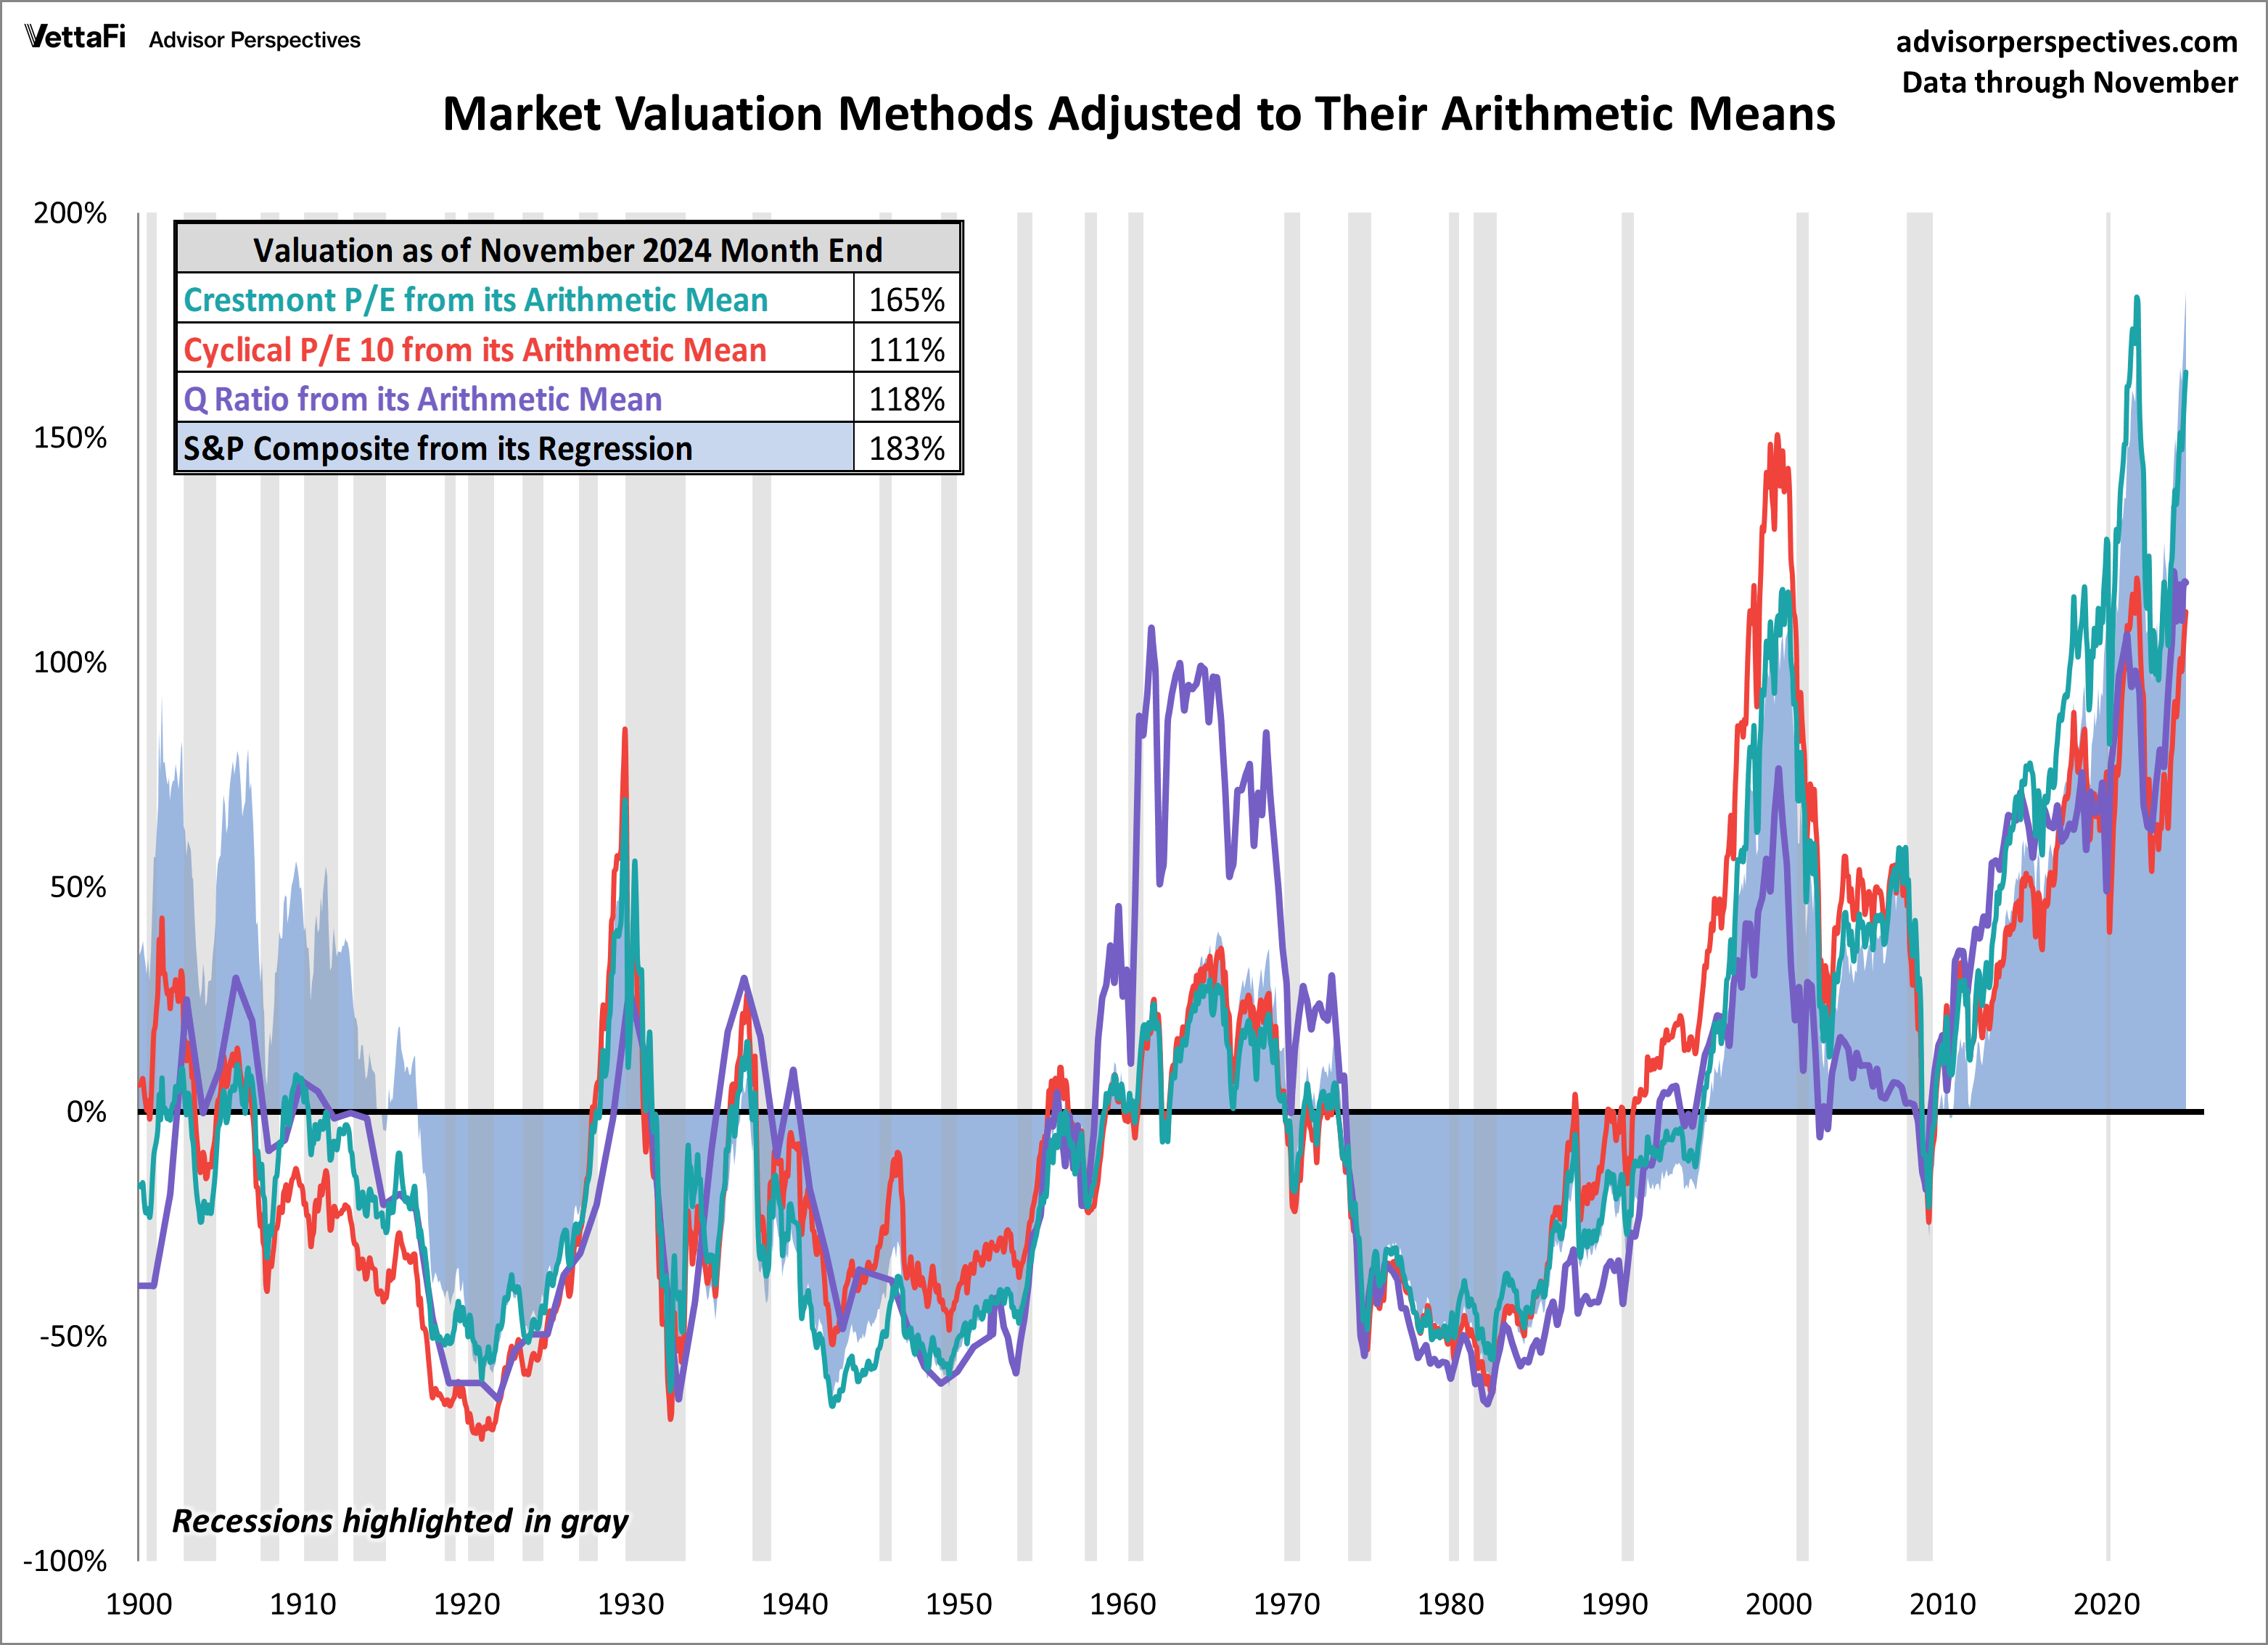
Right now, most measures of aggregate S&P 500 valuation are as high as they have ever been and some are at their highest points in history.
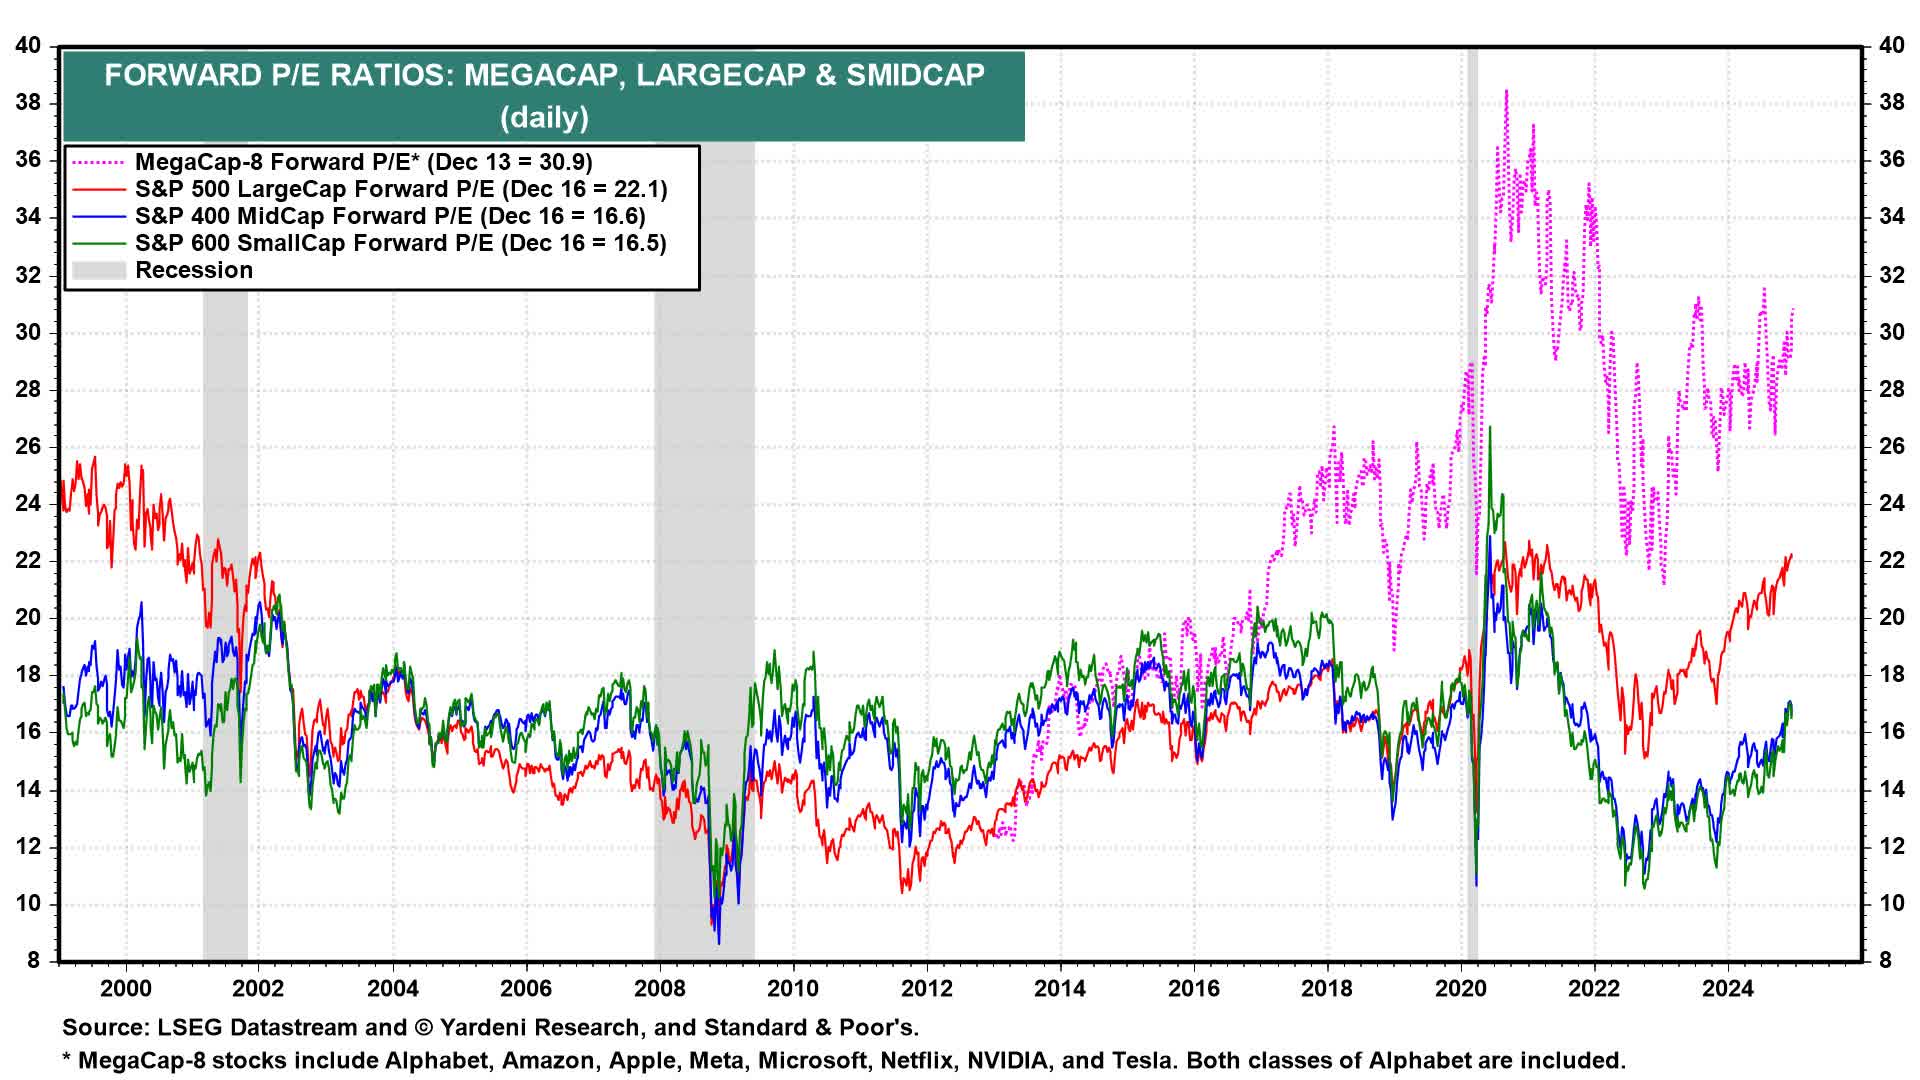
What we see above is that megacaps broke away from large caps after what I call the stealth bear market of 2014-16 which was a choppy and sideways 2-year round trip. That coincided with a round of Federal Reserve QE.
We also see that large caps broke away from SMID caps when the massive Covid QE and government bailouts happened. It’s important to consider how liquidity flowed into the top market cap stocks, especially in consideration of how indexing has developed the past couple decades.
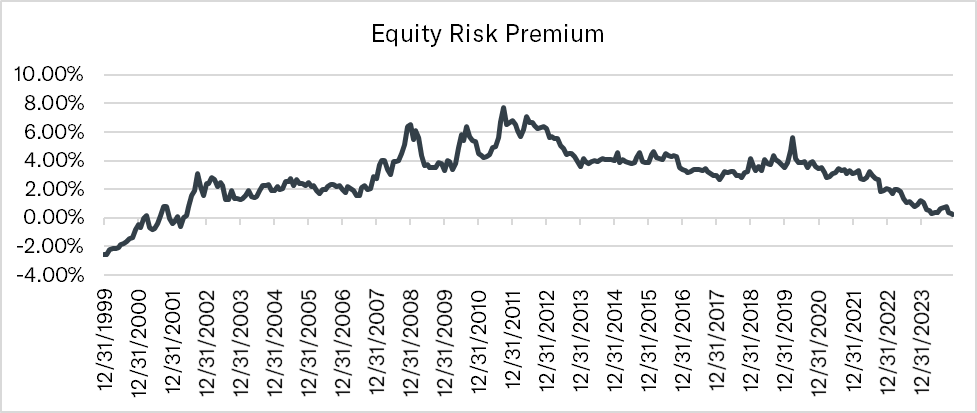
What we see is that the equity risk premium for the S&P 500 stocks (remember, on aggregate as an index) is essentially zero. There is no free or cheap lunch right now save on very select and harder to find individual stocks.
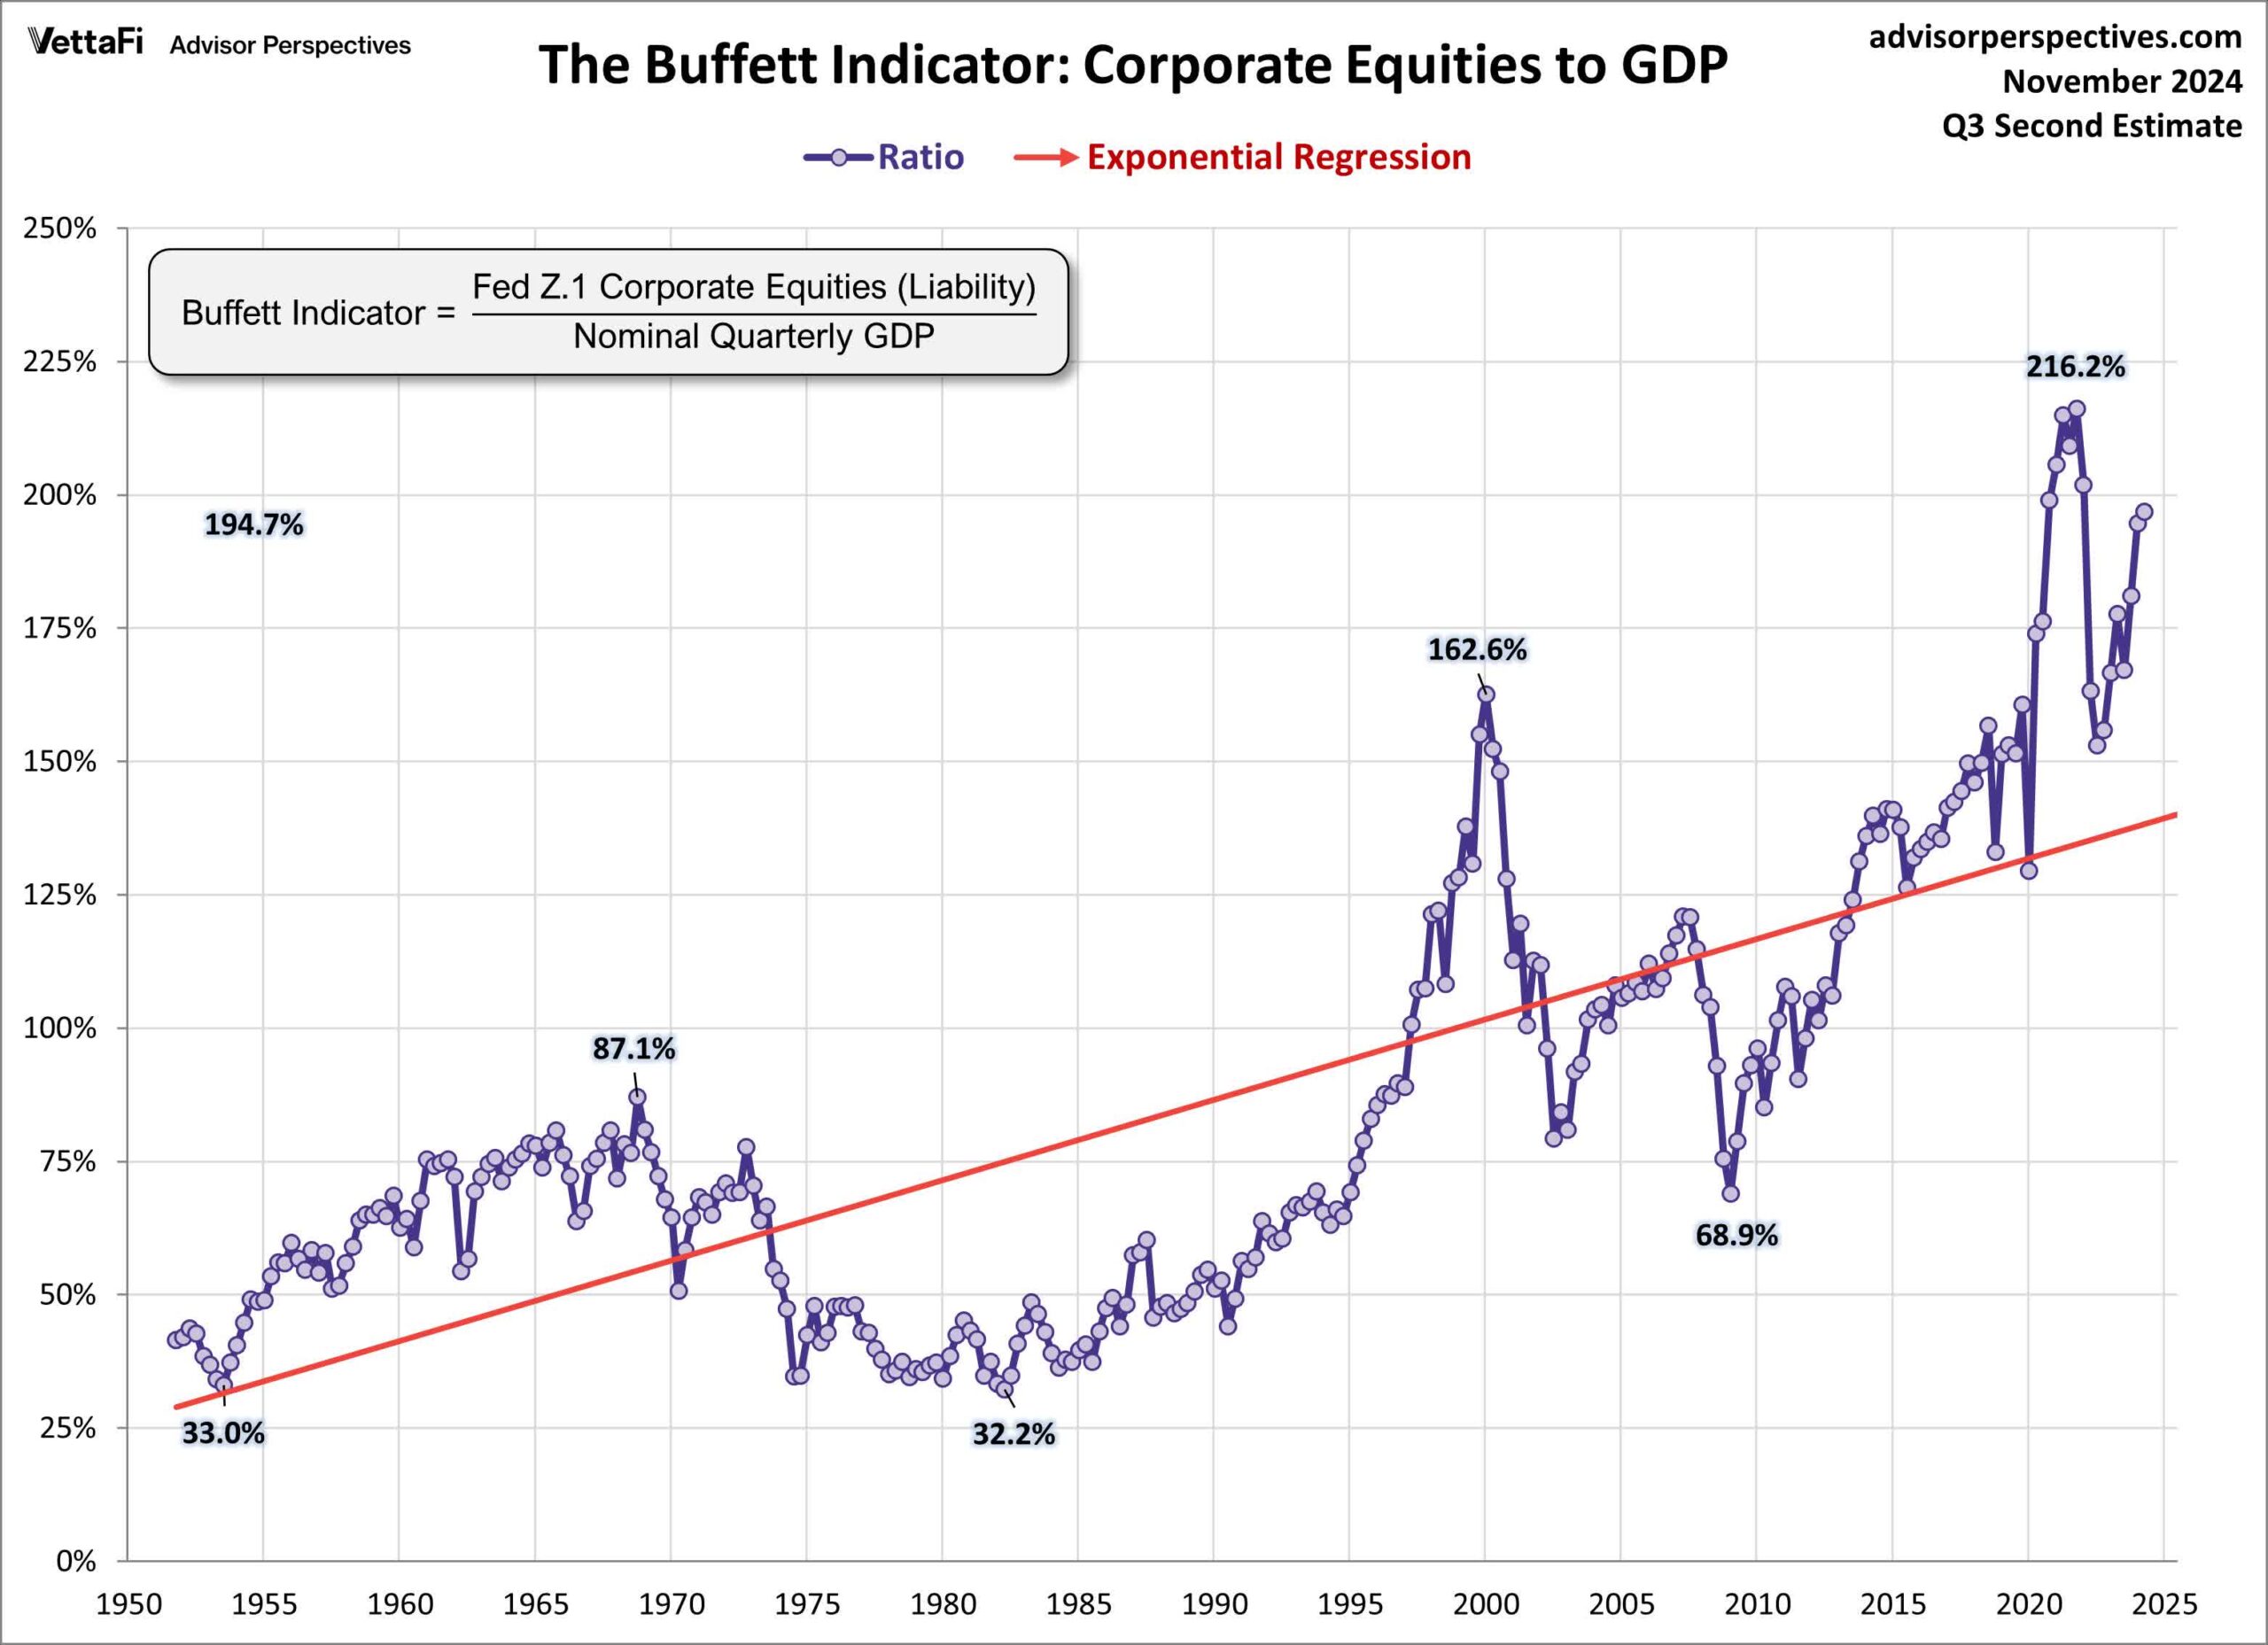
Multiple valuation measures are now showing historically high valuations.
Perhaps the famous Buffett Indicator is among the reasons that Buffett has been a net seller in 2024 and amassed a record cash and short-term bond investment stockpile.
These valuations are like kindling waiting for a spark to ignite it. The dryer the wood gets, i.e. the higher valuations go, the easier it is to light. Once ignited, most of that wood burns. If the fire lasts long enough and gets hot enough, you end up with a lot of ash.
What I say to clients, investment group members and in interviews is a simple thought: “valuations eventually matter.” I don’t know exactly when eventually is, but it is not that far away if history once again rhymes.
I covered similar ideas at the end of 2021, when I warned of a bear market in 2022. A warning that got me labeled a “permabear” by several analysts and commentators. There was a bear market in 2022 (which I correctly told people to buy into in the second half of the year).
Potential Recession
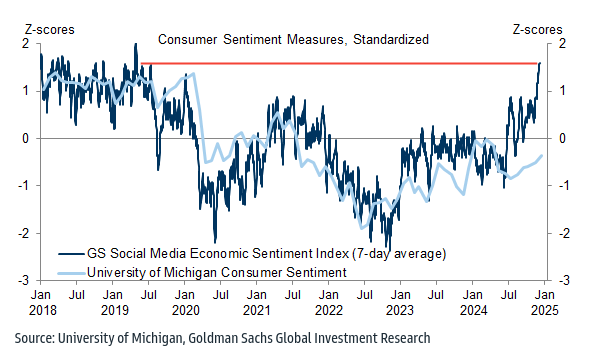
Let’s start by looking at consumer sentiment for a clue as to whether an economic slowdown or recession can begin in 2025.
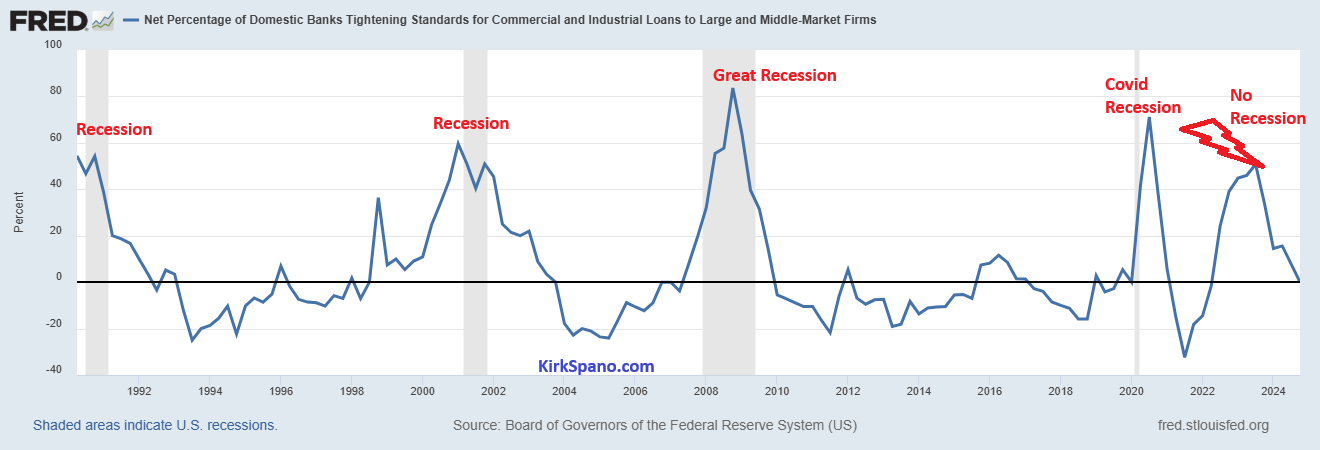
Extremes like this always reverse. That is generally indicative of a slowdown in the economy. We can watch credit for an easy indicator.
So, the question becomes, when will credit tighten. That will be an easy thing to watch. We could see credit loosen further and see the mini-bubbles become mega-bubbles. Or, we could see some tightening and air come out of the bubbles, allowing us to buy cheap for the next phase of a bull market.
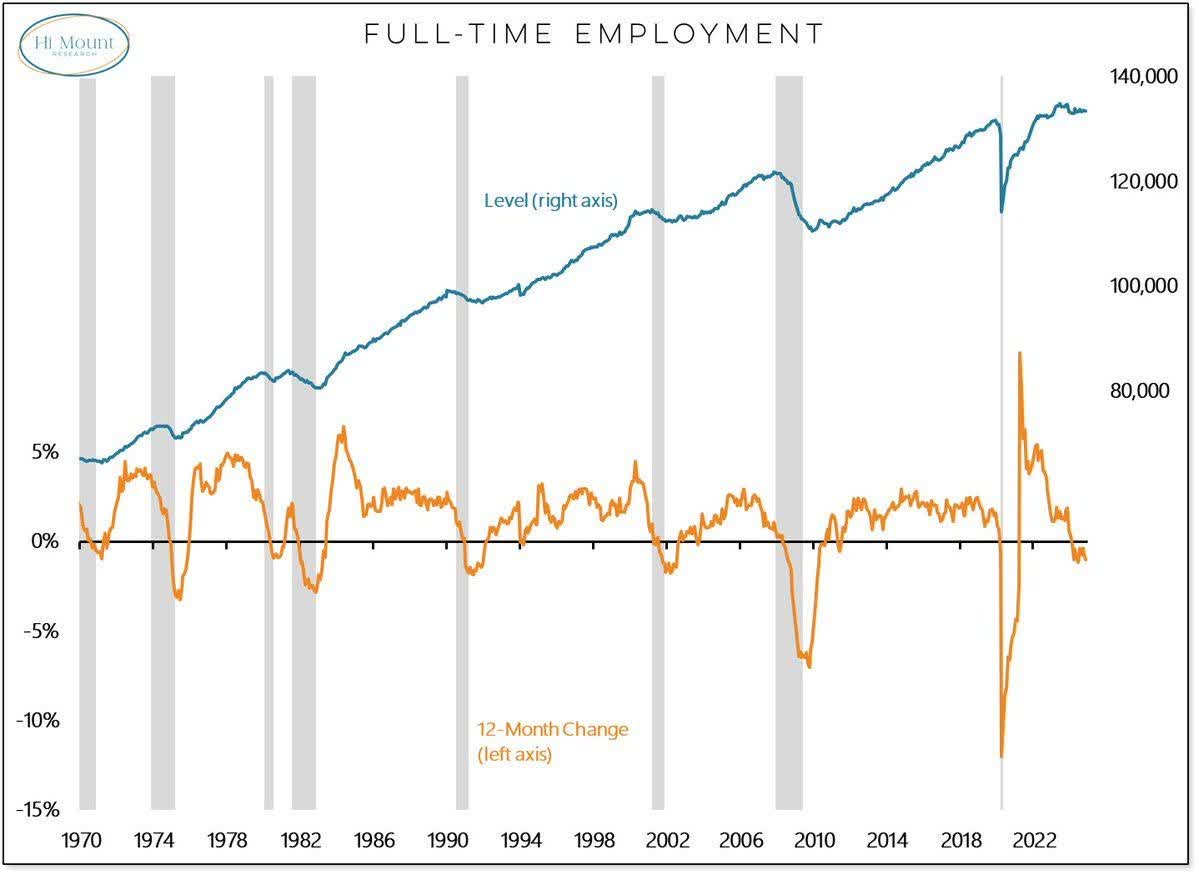
Full-time employment is also another big indicator to follow.
Anytime full-time employment falls year-over-year, there is a recession. There has not been an exception. It is important that this chart does not rollover.
There are two major risks. The first is that we have 3 to 4 million Boomers leaving the workforce each year and only three-quarters are being replaced by younger workers.
Immigration has filled the gap since the Financial Crisis. If the Trump Administration really does mass deportations, versus focusing on actual criminals, then we could see the full-time labor force turnover and get a recession because of it.
While AI will change the nature of work over time, it is not close to offsetting the retirement of the Boomers. What we should roughly expect is that we can maintain full-time employment as certain tasks become more automated.
This will not be much different in nature to what happened with outsourcing jobs to cheaper foriegn labor, AI will just be the cheaper labor.
So, the my takeaway is that we do not necessarily need to see that chart rise much, but we need to avoid a significant decline to maintain the economy.
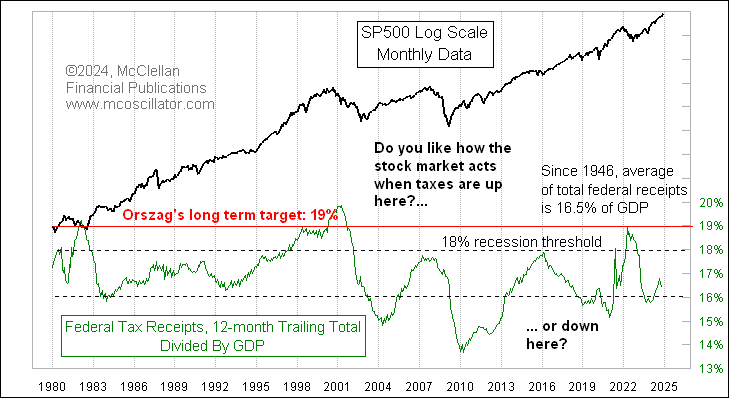
We also know that if tax receipts become too big or small a share of GDP.
If taxes aren’t between 16% and 18% of GDP, bad things happen, or are happening. While we all love tax cuts, and none of us like high taxes, too high or low is a bad thing for the economy.
As I suggested in this piece, we were getting an economic soft landing.
Powell And The Fed Are More Dovish Than You Think: The Soft Landing Is Here
Let’s see what the Leading Economic Indicators said a few months later.
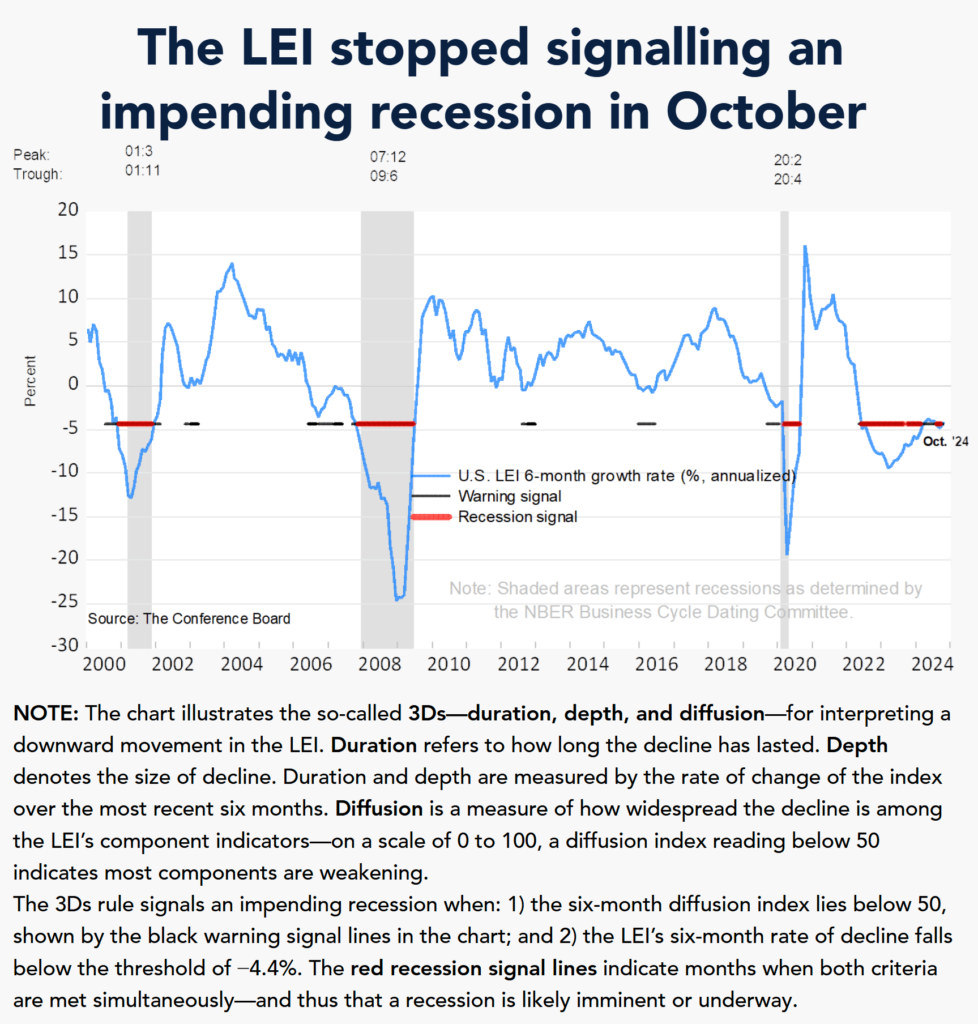
Right now, we are in a tenuous spot as LEI has started to fall.
Let me finish by putting some context on things.
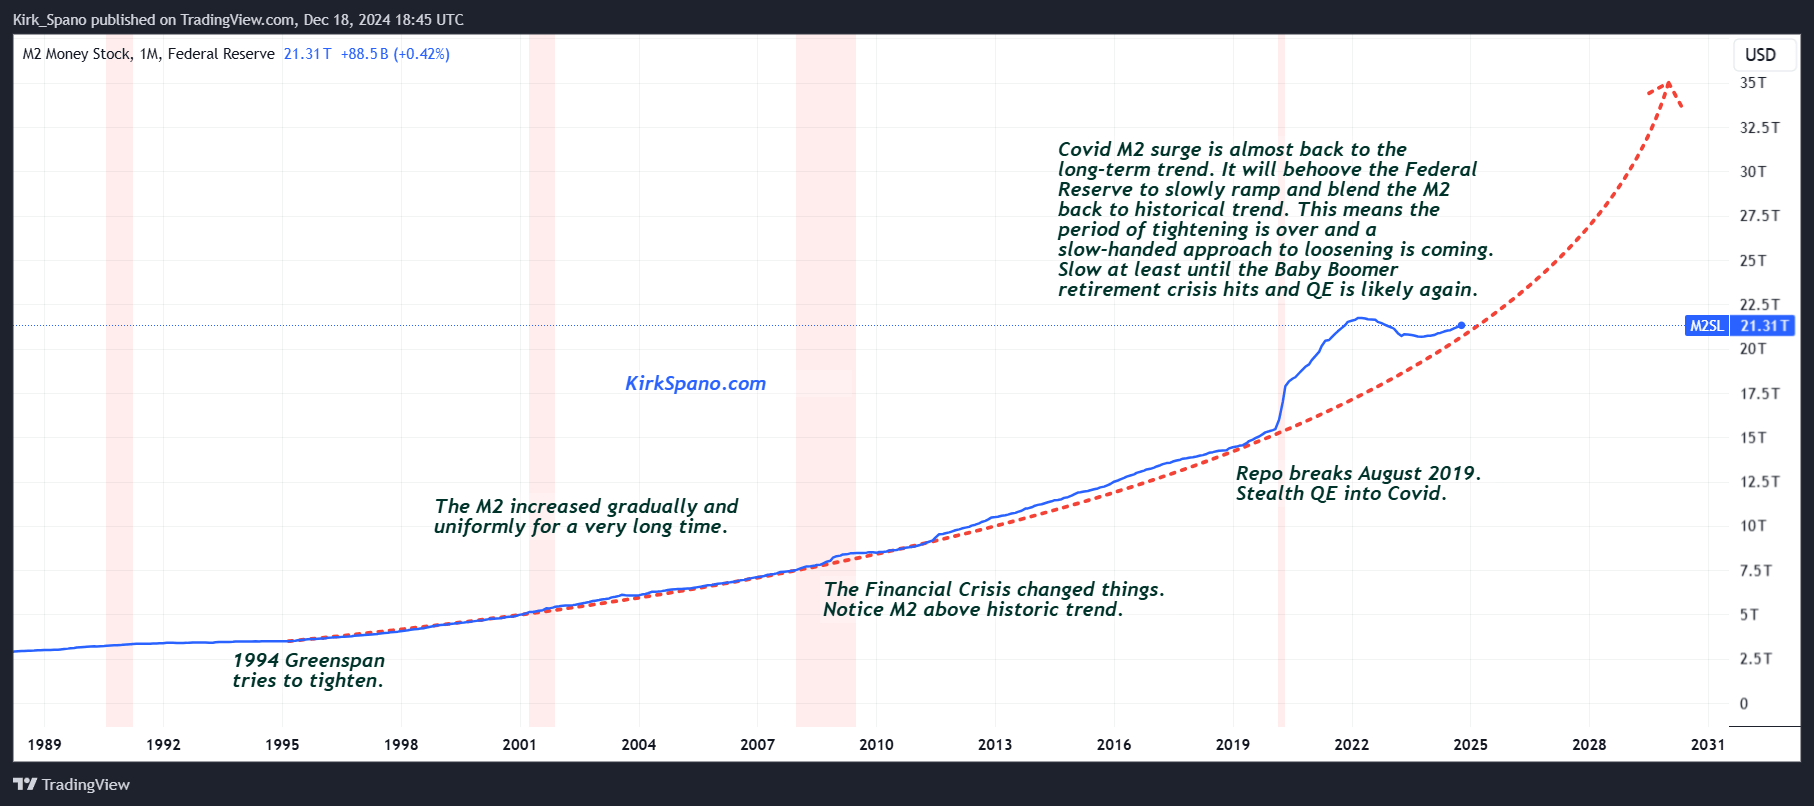
The Covid bailouts are still very much in play. The amount of money printed via QE and government programs was massive.
The bailouts were far larger than the ultimate hole in the economy from Covid. I have suggested that was done for two reason.
- Government and Central Banks erred on the side of a bigger recession possibly occurring because they just didn’t know what to expect.
- If the bailouts turned out to be too big, that would help mitigate the impact of the looming demographic crisis we have coming around the end of the decade.
This chart shows how M2 money supply has maintained a steady trend for a very long time, but then jumped massively during Covid.
We are close to seeing the trend back to normal. If it bends down, that’s probably recessionary. If it bends up, that’s generally expansionary.
Inflation
There is a risk that if the Fed loosens too much, that we could see a resurgent inflation. That is true.
I have said for about 20 years now that ultimately we would inflate our debts away. It is more complicated than that, but, at least partially true.
The risk of the Trump Administration causing inflation is high in my opinion. One of the main causes of the inflation we saw after Covid, beyond the bailouts, was that supply chains were broken. Toilet paper, cars or heavy machinery anyone?
If the Trump Administration governs to the tariff rhetoric, there is a very good chance that we see inflation from broken supply chains in the short run and retaliatory tariffs. Something to monitor.
Energy is potentially going to get more expensive for a little while due to cyclical factors and risks in the Middle East. Energy, like any commodity is relatively self-correcting over time. Higher prices are the cure for higher prices.
In addition, technology is improving alternative energy, the grid buildout is fortifying U.S. energy transmission, Permian oil and gas production is strong at least for a little while longer and we have already seen the first signs of what I have labeled “panic pumping” by oil producing nations.
An all-of-the above energy strategy should mitigate U.S. long-term energy costs. Abandoning AOTA would likely hurt in the short run.
The important thing to be aware of is that energy costs can shock the economy for at least a while on any extreme events, generally war, but sometimes bad government policy.
Stagflation
The worst case scenario is that we get inflation and a recession at the same time. President Trump’s economic advisor Gary Cohen sounded warnings about this in 2018.
While we might like certain outcomes touted by the Trump Administration, the policy approach might not be optimal (I have been trying to be more diplomatic since I turned 40, as I am now about to be 55, I’m still working on it, but think I am much better now).
If we get whiffs of stagflation, that will be a “sell almost everything” moment.
Liquidity Tightens
Apollo Global Management and other researchers have clearly showed how tightly correlated market liquidity and stock (and other risk asset) prices are.
Any economic factor that tightens liquidity is likely to cause at least a pause in asset prices appreciating and usually leads to a correction.
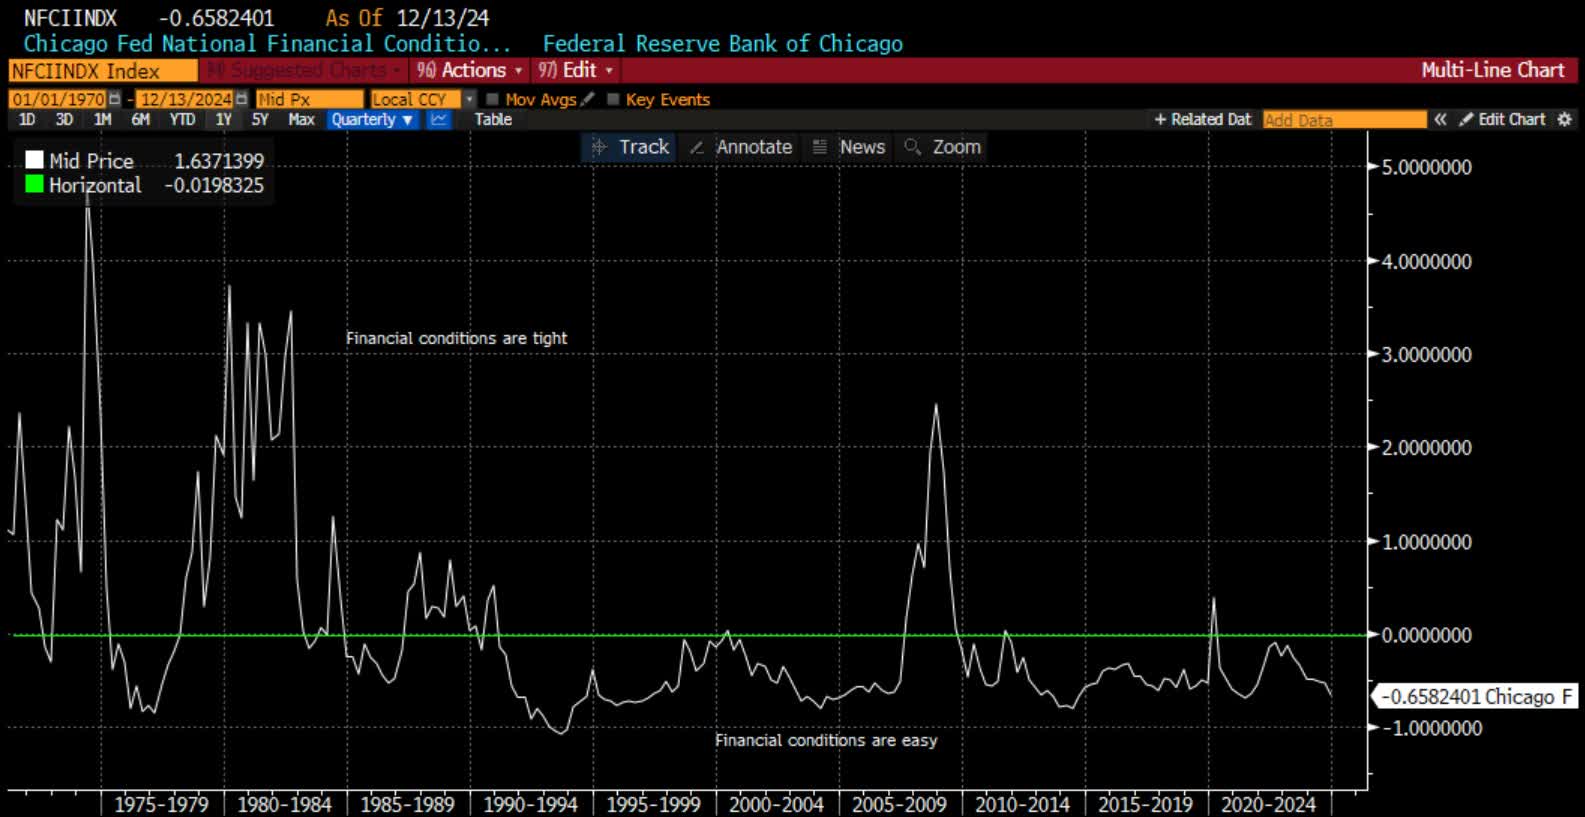
Right now, financial conditions are easy, but not super easy.
On Wednesday, the Federal Reserve did not cut interest rates as much as forecast and ended up cutting by a quarter point on the Fed Funds rate (very short-term money) and indicated only 2 or 3 cuts in 2025. I think that will likely be exceeded on some slowness in the economy developing as warned about above.
What most people still miss is that the Federal Reserve continues with Quantitative Tightening, aka, QT, that is, a way to tighten that is different than the manipulation of interest rates.
I think, the Fed ends up lowering rates more than forecast on the dot plot at the recent meeting, but that QT continues as an offset.
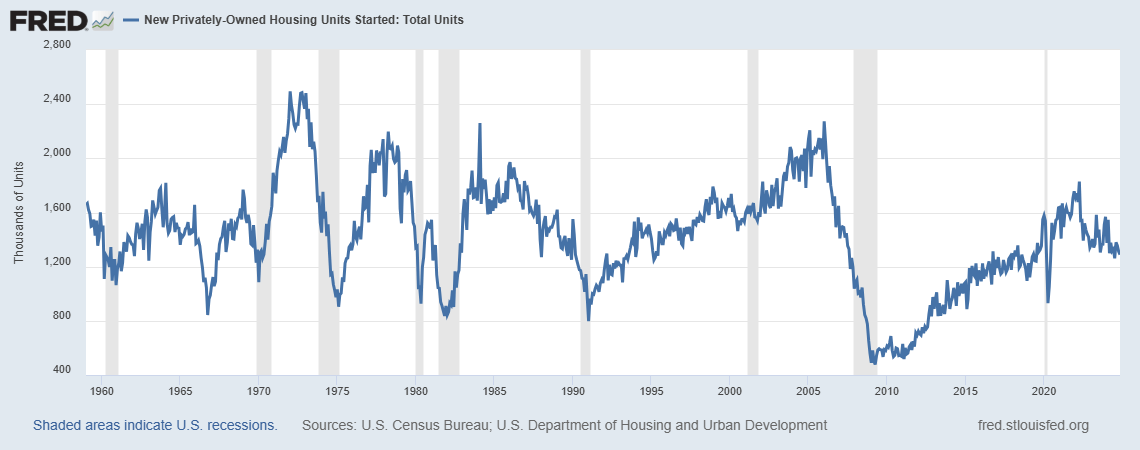
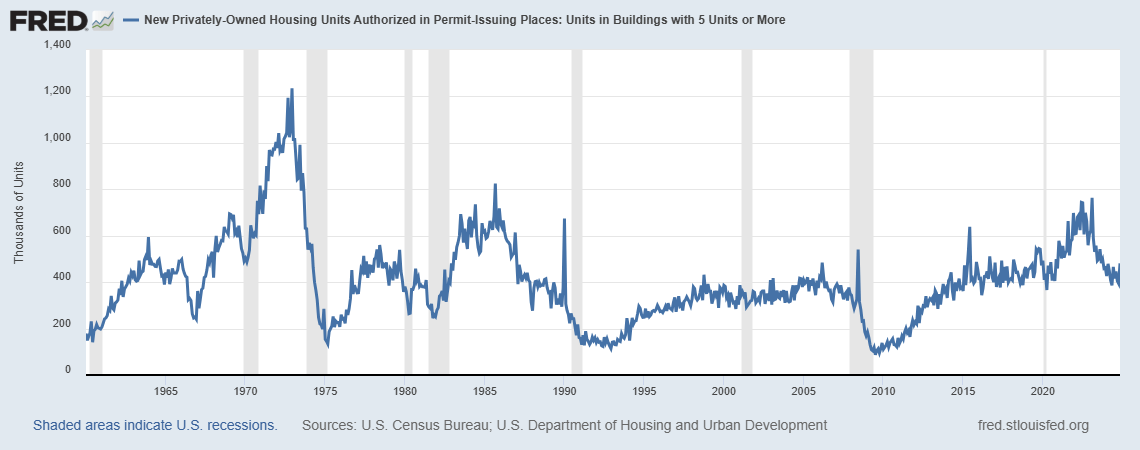
As I have discussed before, we need to see lower rates on the 5-year note in order to stimulate business development and construction, in particular, of multifamily housing. Notice that recessions often overlap with lower building.
Housing Starts (FRED)
As someone who works with developers, I can say with high confidence that in order to raise capital for projects, that internal rates of return need to be middle to upper teens on a proforma basis to attract more investors.
Understand that most of those loans on multifamily are 5-years and then reset. That is why there is stress in the system now due to commercial loans made late the last decade.
With 5-year lending rates mostly between 5.3% and 6%, higher than the 5-year U.S. treasury rate, which is required so banks can make a spread. It is difficult to get the required IRR right now.
If banks cannot refinance existing loans with some space between loss reserves and what they actually lose on underwater commercial loans, that will further stifle loans for new projects.
We need to see those 5-year UST rates down to below 4%. Those rates were under 3% in 2019. That implies that the Fed needs to lower about another point, and preferably faster, versus reacting late.
Chairman Powell did acknowledge in his statements this week that Fed policies were contributing to lower building starts and that we are now a percentage point closer to what we need than we were six months ago. I do not doubt that rates come down, but, I wonder if it’s in time to avert a recession and whether or not the uncertainty of the new administration muddies the wheels.
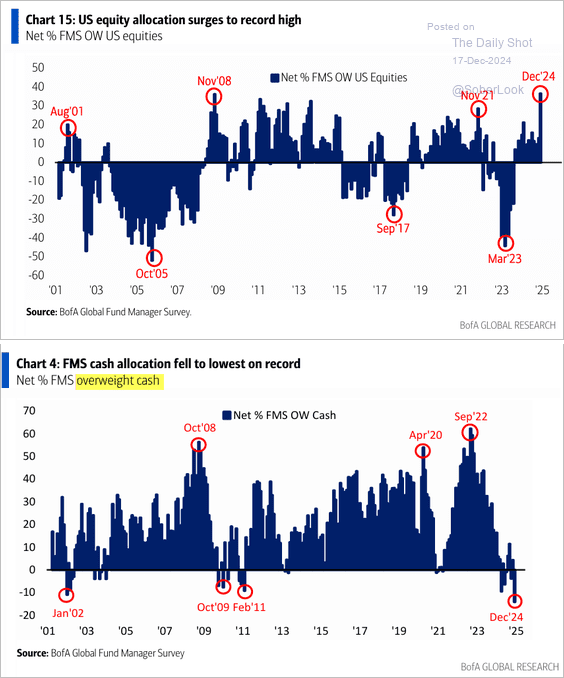
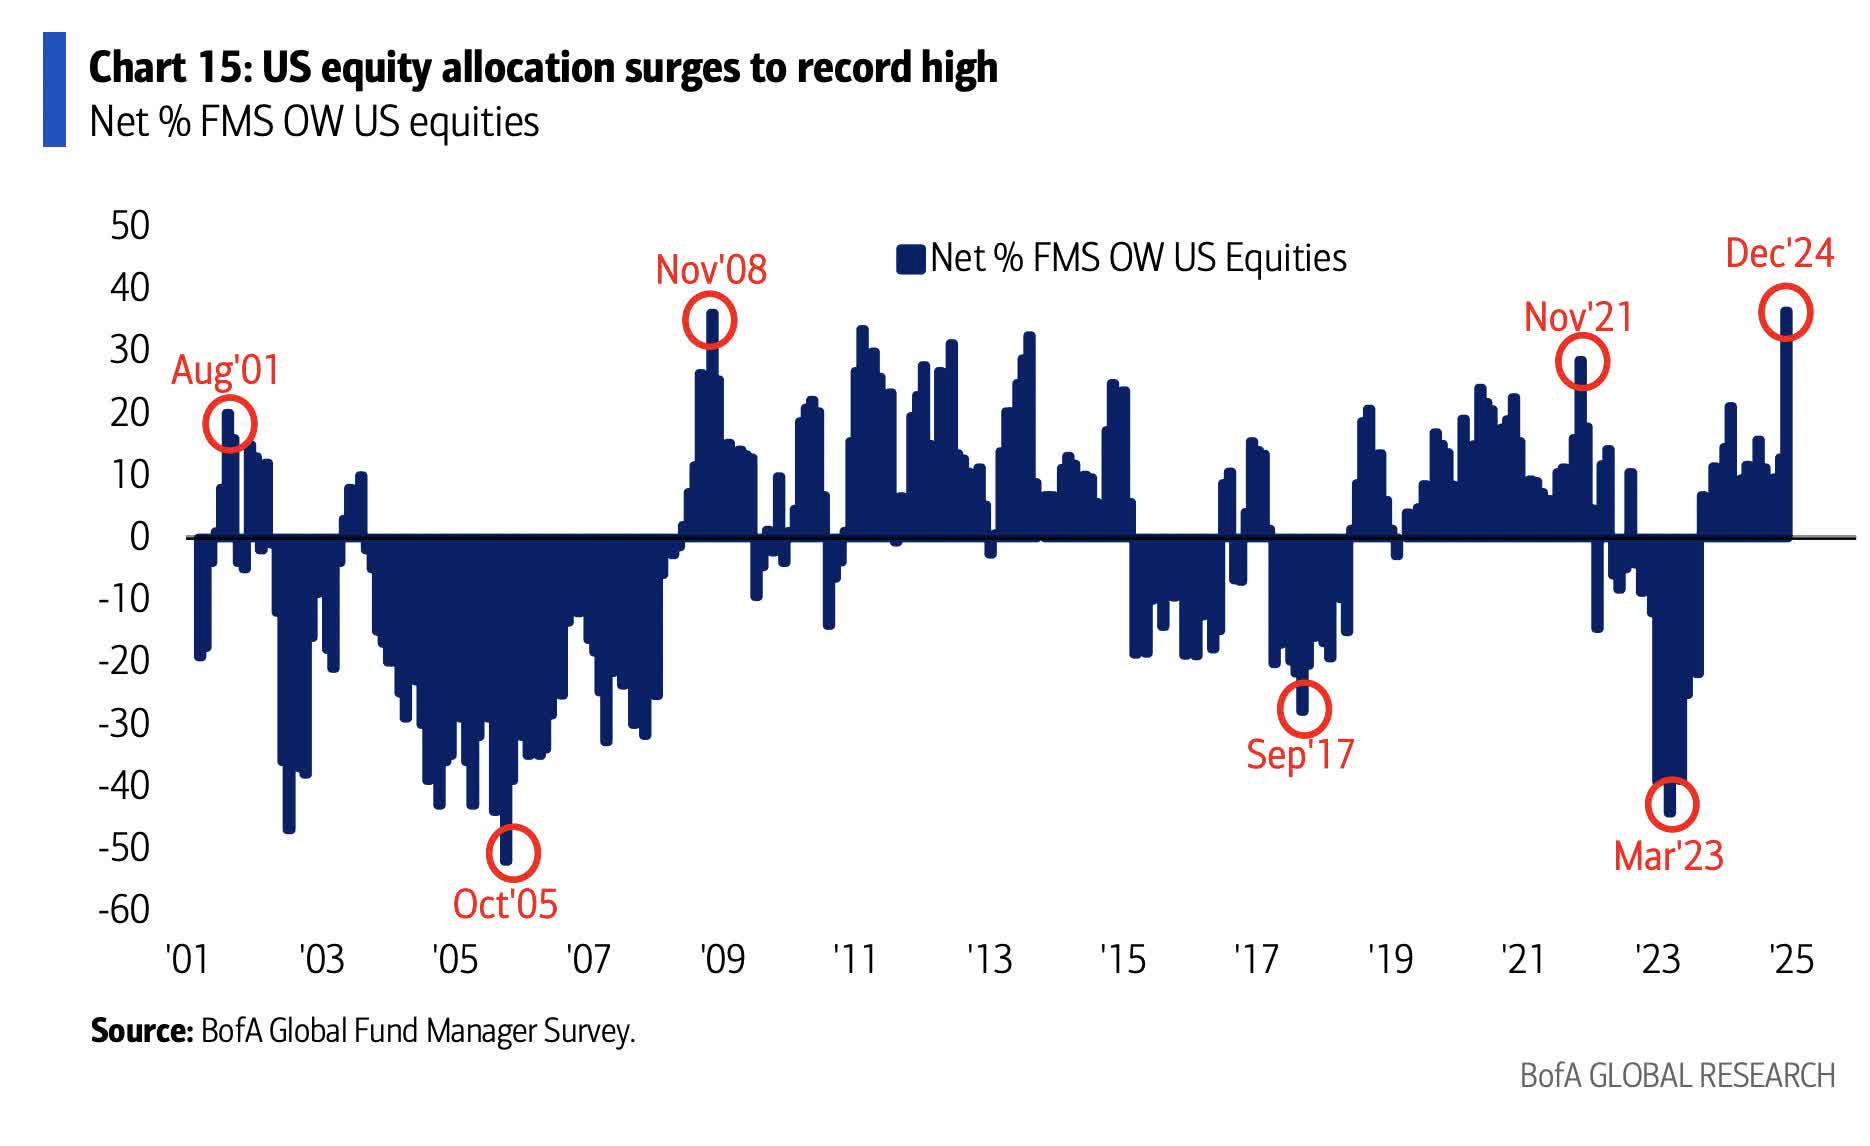
Besides in real estate, how does tighter liquidity manifest? Fund managers often run out of new money to invest.
Cash Low At Funds (BofA Global Research)
We can easily see the correlation of stock market peaks and corrections to when funds have cash and do not have cash to invest.
Think inflows and outflows. When funds are short on cash to invest, they have to create liquidity, that means selling, that in turn means lower prices.
Earnings Disappoint
The easiest way to see a stock market correction is if earnings disappoint. Here we are somewhat at the mercy of short-term thinking by Wall Street and other financial analysts.
Remember, their outlooks are one quarter and one year for the most part. For 2024, they underestimated earnings by a few percent. The result were a series of beats and a stock market rally.
For 2025, according to FactSet, they have raised their earnings growth estimates to the lower teens for the S&P 500. It is overcompensation in my opinion. Bluster trying to catch up. And, I think wrong.
If earnings miss, stocks will go down. I think that starts in April and May, but, it could happen, as soon as, January and February. I am being very selective at this point.
Goldilocks Economy
There is always the possibility that things just work out. In the longer term that is universally true. In the shorter-term it is less certain. I err to the bullish side, which has been the right thing to do since World War II.
So, while I see risks rising, we want to ride positive trends while they last.
Here’s what Sequoia Financial Group said about the economy recently.
With third quarter earnings and the presidential election in the rear-view mirror, last week the financial markets turned their attention to the economy. Thus far in 2025, the economy has grown at a measured pace that has allowed inflation to fall and corporate earnings to climb – a so-called Goldilocks economy
So, with no recession now, maybe a little slow down over the winter, which is typical, can be readily absorbed and the economy picks up over the summer. That is what I am hoping for, as you should be as well.
If nothing gets broken, the odds of a slowdown recharging the economy is, as always, the most likely scenario.
My worry is something gets broken.
Technical Analysis
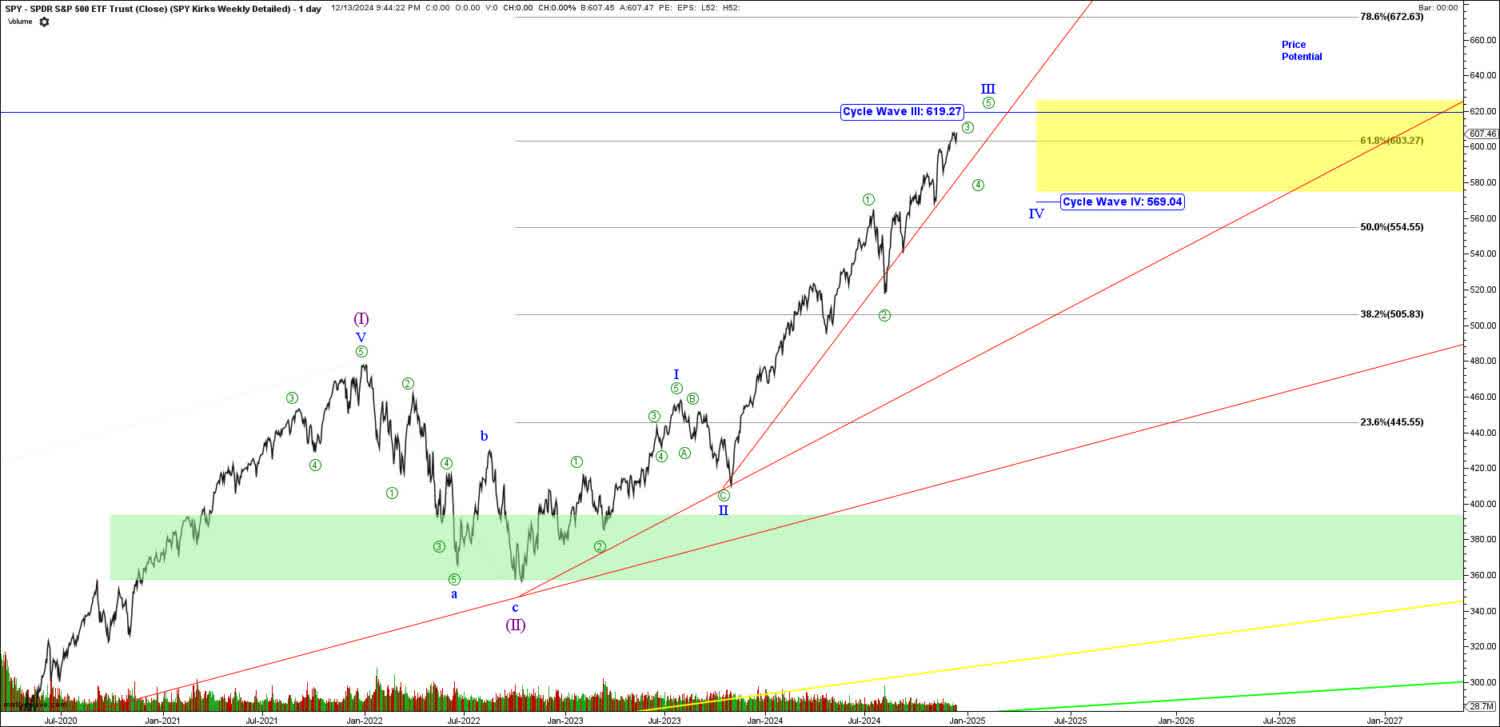
I will keep this simple in order to show some ranges of what can happen in 2025 and really into 2026.
That center red line is the most likely area where a correction can head to. If the economy doesn’t break, then that is a likely area to start scaling into preferred stock holdings.
If the economy breaks, recession or stagflation, then the lower red line becomes the more likely range with the bottom green bar being very, very strong support where we would be compelled to hold our breath and buy stocks.
We will include more technical analysis in our Global Trends ETF articles.
U.S. Stock Market Asset Allocation 2025
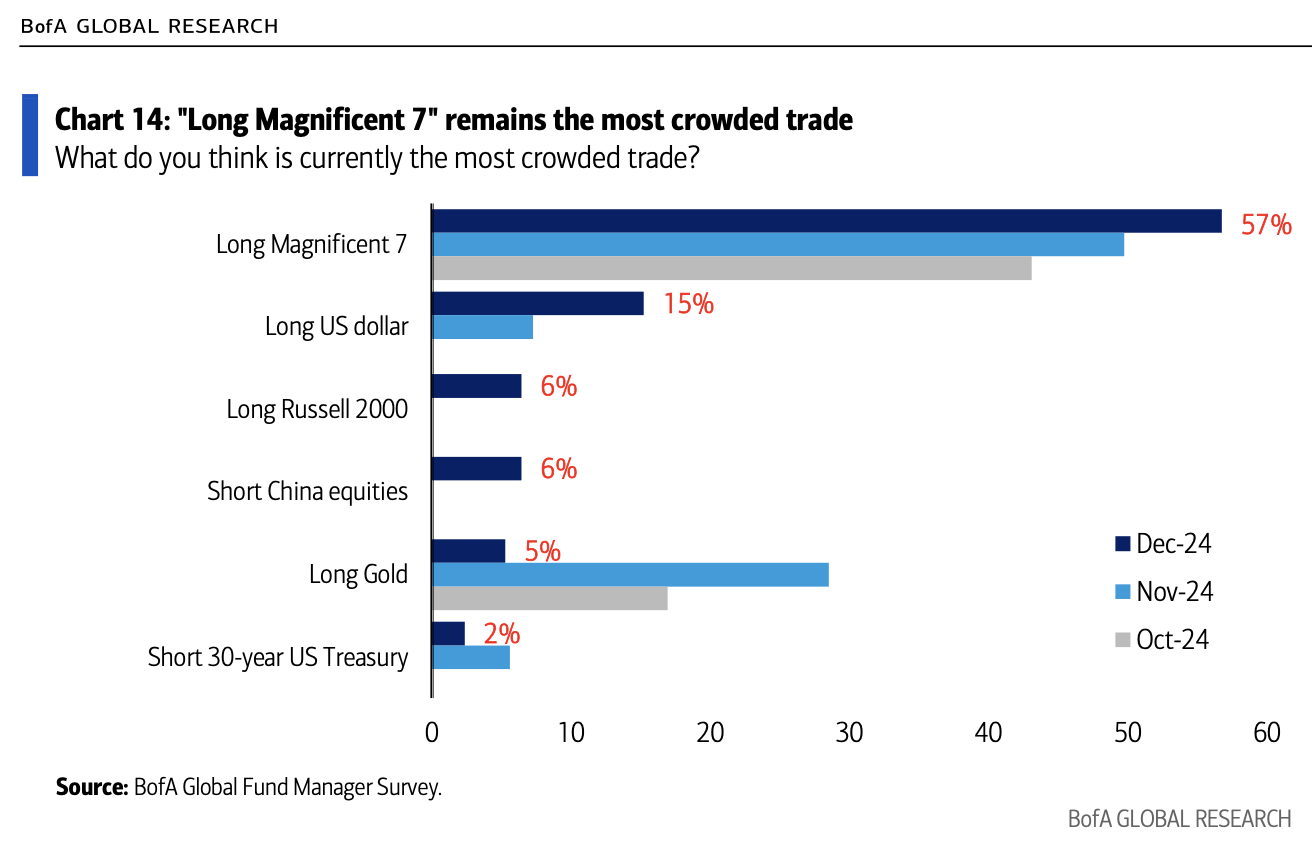
Let’s take a look at a few market dynamics. The first is the one folks talk about non-stop, the top heavy nature of the stock market.
If liquidity does in fact tighten, what is the most likely group of investments to be sold off? The most liquid, which is the Mag 7.
I would consider that an opportunity to buy the Invesco QQQ (QQQ) at some point as those are still among the best companies in the world. All seven of the Mag 7 are top 10 holdings in QQQ.
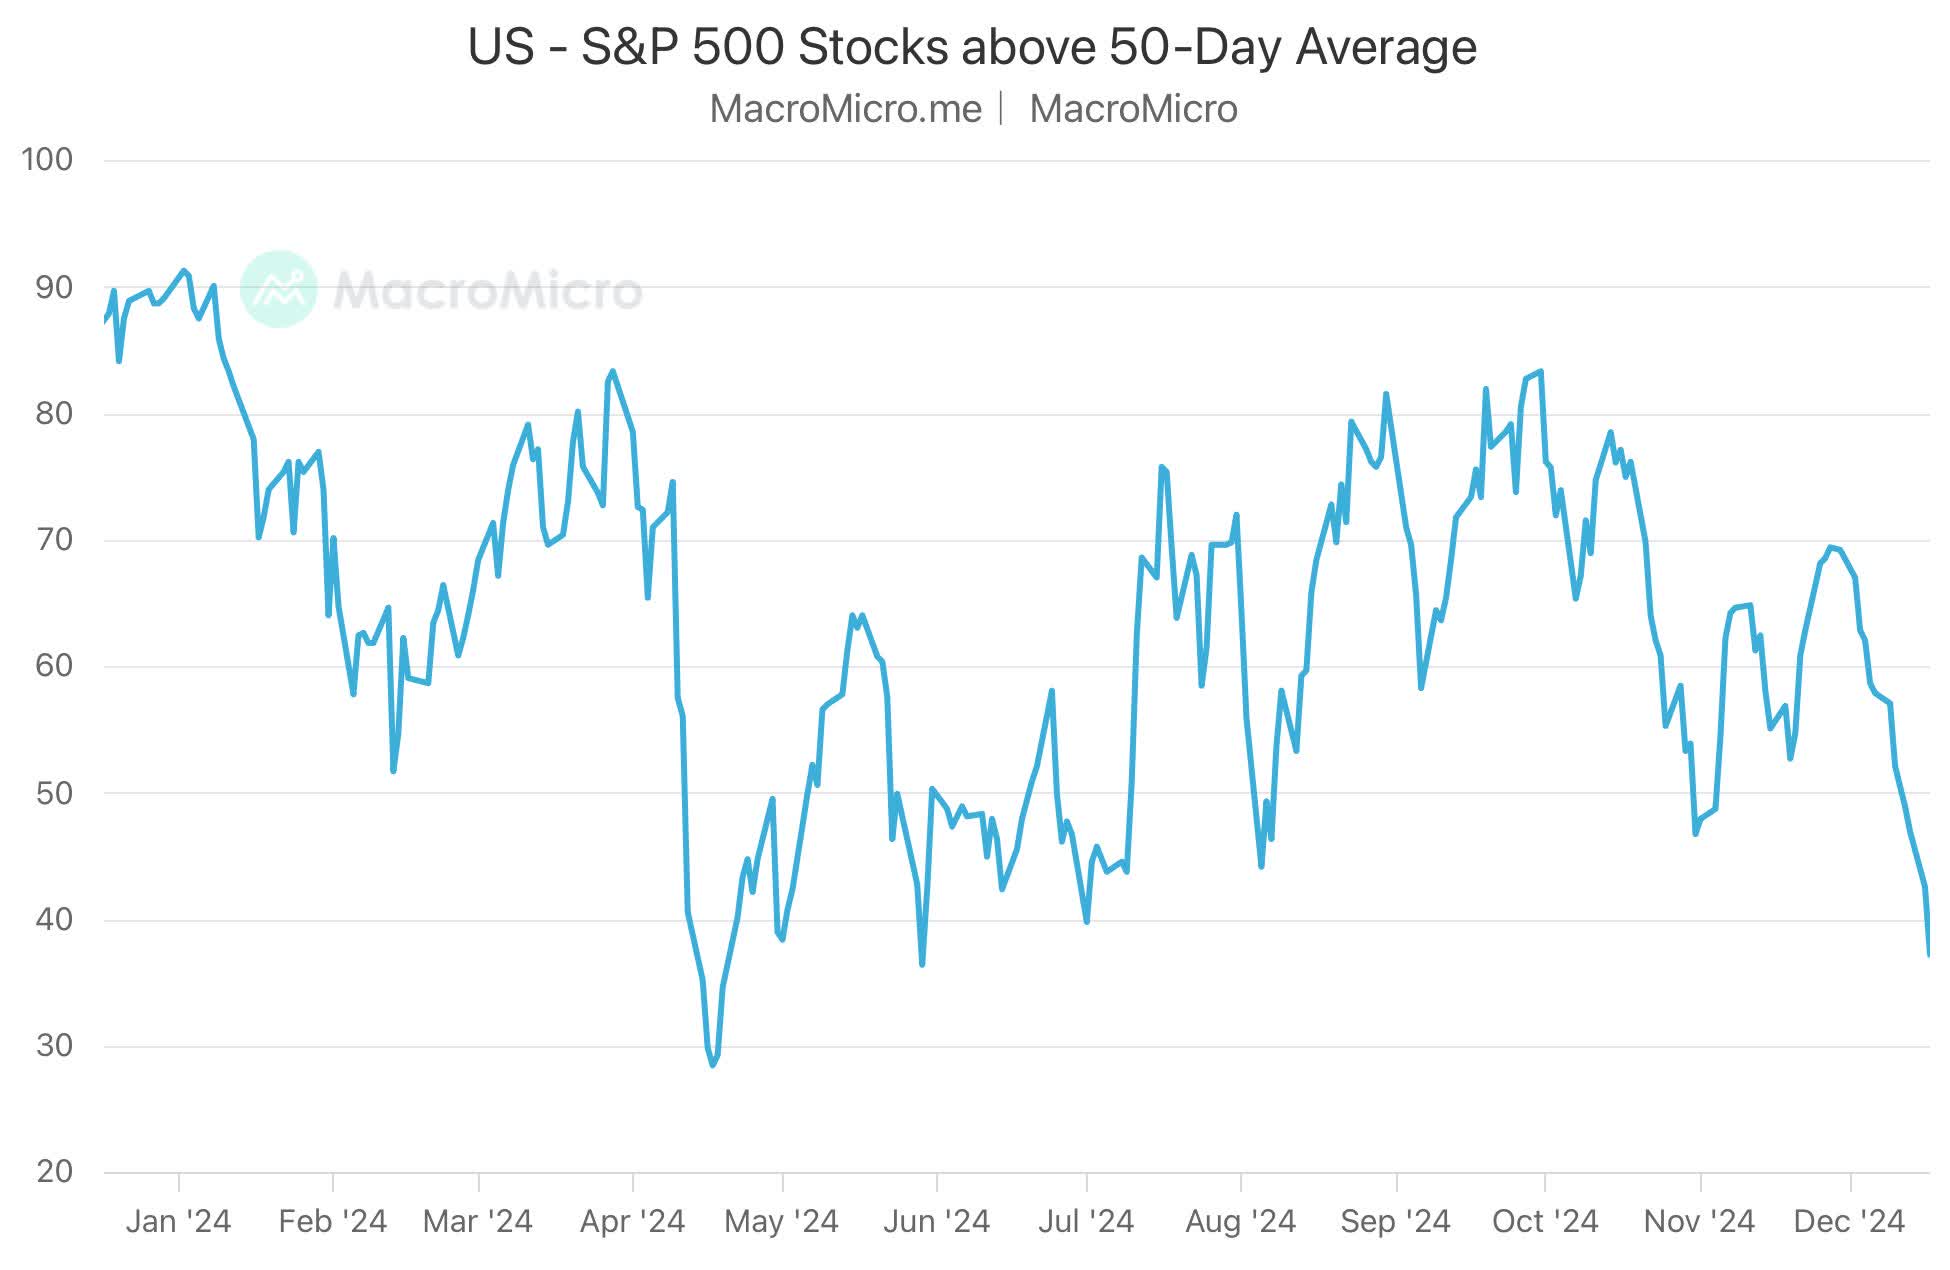
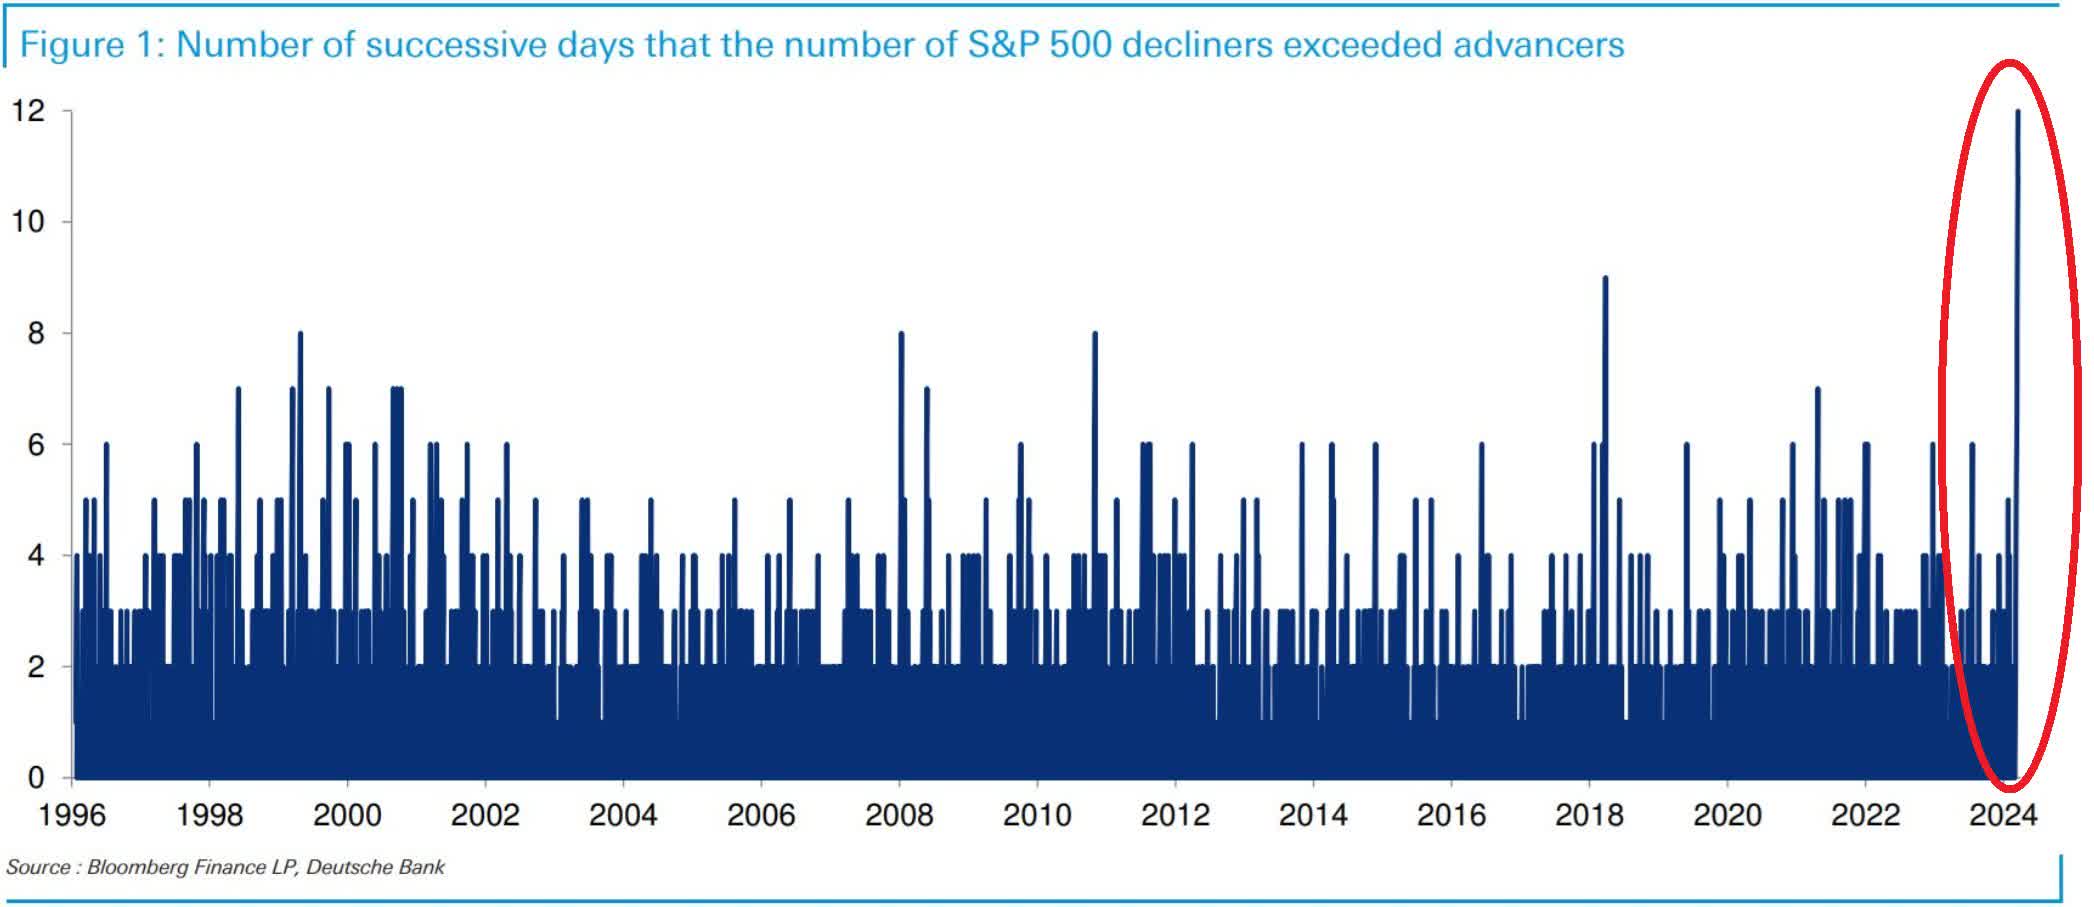
A correction also opens up other opportunities. We know that market breadth is narrow.
We have talked about market breadth before. When it gets around 80, we usually see a market pullback or at least a pause soon after as breadth contracts again.
What those two charts say to me is that either the downturn accelerates or we see a bit of a rebound into Q1 2025.
If I were a betting man, and you know I am, I’d be selling large caps into a rebound in Q1 if it occurs as I expect, because I think the other risks I have identified are high in 2025.
Small caps are always another story. The iShares Russell 2000 ETF (IWM) often gets cited for small cap stocks. While indexing to the S&P 500 (SPY) (VOO) can be a worthwhile strategy in a bull market, using IWM rarely is.
Why is that? Simply, almost all companies in the S&P 500 are profitable (at least marginally), but fewer than half of small caps are profitable. So, I never use IWM. Never.
Opportunities in small caps are always best selected individually based on things the market is missing and then waiting for the market to “discover” the small caps you own.
Of course, small caps come with greater financial risks that must be monitored. Like everything else, we want to ride our winners and “fire” the companies that start to fail.
It’s important to note that “fail” is not a price issue, it is an execution issue. We get rid of small caps when the thesis changes, not because low information investors aren’t buying yet or short sellers are ganging up.
That brings me to Mid cap stocks. You can be a stock picker, which we do, or use momentum based ETFs.
Why momentum based? Because the S&P 500 acts as a magnet for the fastest growing mid cap stocks. So, those are overweighted in a few of the mid cap ETFs that we use. That’s good. Ride the winners.
International Investments
Americans are very underweight foreign investments. That has served them well since the Financial Crisis and advent of the QE era. I do not expect that to change much as I expect more QE to bailout the retirement system around decade end.
However, there are some spots for foreign investment. They share most of these factors:
- Rule of law.
- Sovereign security.
- Younger educated populations with lower welfare system dependency.
- Resources that other nations want to buy.
- Infrastructure.
- Technology.
I like the following places to invest best:
- India on growing wealth.
- Southeast Asia on growing wealth.
- Latin America on growth tied to proximity to U.S.
- OPEC nations because of oil wealth and pivot to diversify.
- Australia as a major resource provider.
I think Ukraine could be added to the list if the war there ends and there is a concerted rebuild effort supported by hundreds of billions of international dollars. I’m hopeful, but want to see the signs. Ukraine would probably be a 2026 or later addition.
I am looking to buy a Latin America ETF in 2025 as the Brazil financial crisis subsides. I’d expect that in the second half of the year, but will monitor it to see when the time is right.
Ultimately, I would like around 20-30% of my portfolio tied to these international investments for long-term diversification, but it could be years before we get there.
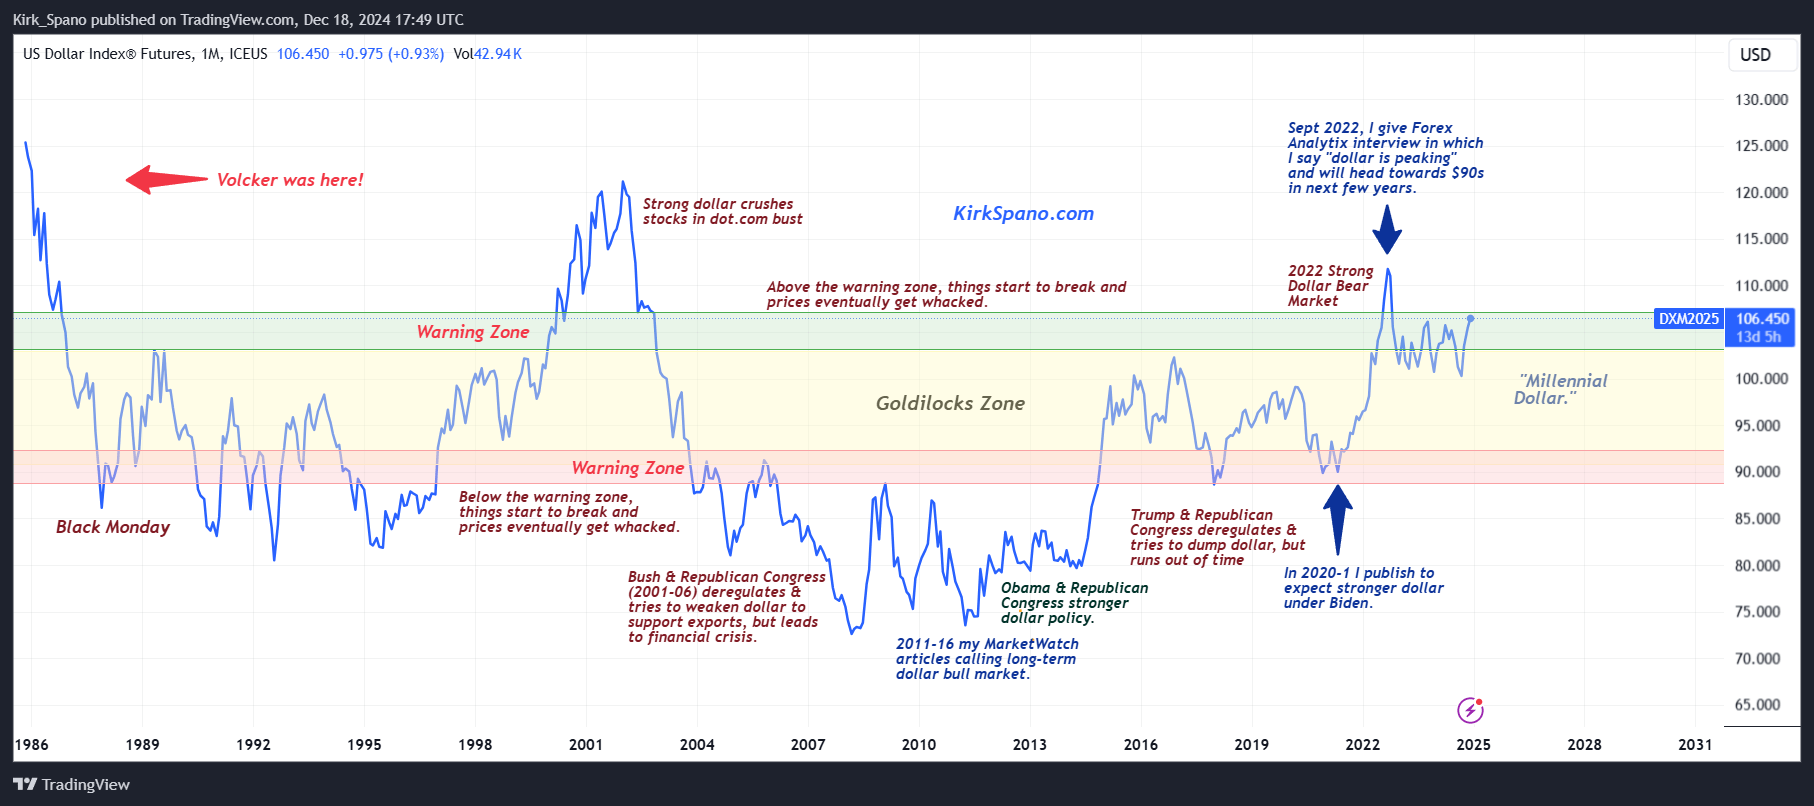
Foreign investments are best when the dollar is weaker. We have seen over a 12-year rise of the dollar versus other currencies.
You can see there is risk in the current level of the dollar.
The Trump administration would like to weaken the dollar, but, I think it will take massive QE for that to happen much. Again, I think massive QE occurs around decade end, but, could happen sooner. We’ll react as we get information.
Bitcoin And Fixed Income
I am placing these together because I do believe that Bitcoin (BTC-USD) is developing a role in the international currency and fixed income markets. I will argue that more over time, but, for now, understand that is my viewpoint.
What we know is that since the era of indexing to stocks, the correlation of stocks to bonds has increased.
While many make arguments that Bitcoin is outside of that realm of correlation, I do not think time will prove that to be true.
Yes, I think Bitcoin has a different dynamic in the system as a currency hedge, but it is also subject to the same liquidity concerns of other assets. That is, if liquidity falls, then Bitcoin prices will fall as well.
I do not see that as a reason to sell Bitcoin in most cases, except for overallocation in specific portfolios. Why?
I think we are in about the first or second inning or global Bitcoin adoption as a hedge against the dollar being too strong or too weak. See my chart above again.
With the Bitcoin market cap current just over one trillion dollars and total global assets approaching $500 trillion, Bitcoin is destined to rise in value as it adopts into a functional role in currency markets and trade (we have seen rumor that oil is already taking partial settlement in Bitcoin, and know it has partial settlement in gold).
With all the gold in the world approaching a value of $20 trillion, it is not hard to see Bitcoin approaching that level.
Thus, unless simply allocated too high to Bitcoin, which I define as more than about 12% of net worth, but some might define lower or higher, I do not plan to trade Bitcoin.
I might sell a covered call against a portion of my holdings in a defined downtrend. I will not speculate on a downtrend, I will need to see a technical trend in progress.
For most investors, I think buying the dips will be the correct strategy. If you are not yet comfortable with Bitcoin, please, do the reading. Start here.
Bitcoin: A Peer-to-Peer Electronic Cash System
Bitcoin Milestones: Implications & Impact on Institutional Adoption
Option Selling For Income And Safety
As always, I advocate for being a option seller to collect premiums and mitigate risk. I prefer selling cash-secured puts to, in essence, set a limit order to buy a preferred stock or ETF at a certain price during a certain 1-4 month time frame (my preferred length of contracts).
Sometimes, such as when risk is high due to overvalued and overbought conditions, especially with uncertain economics, I will sell covered calls. I am doing more of that now than usual.
Investment Quick Take
There is a lot of uncertainty in markets and the economy, into a backdrop of overvalued stocks and questionable breadth. The odds of a 15% to 25% correction on stocks and Bitcoin sometime in 2025 are higher than normal years.
If the stock market rally lasts a bit longer and creates even more overvalued conditions, then selling more heavily becomes even more urgent.
I am trimming stock risk, writing some covered calls and looking for more favorable conditions to buy favorite assets.
Author
Kirk Spano
Chief Investment Officer


